.jpg)
Writeup By TrevSec
Introduction
Network Traffic Analysis
can be described as the act of examining network traffic to characterize common
ports and protocols utilized, establish a baseline for our environment, monitor
and respond to threats and ensure the greatest possible insight into our
organization’s network. I am hoping that after this process I will be able to
determine anomalies, including security threats in the network, early and
effectively pinpoint threats. With this I will be able to facilitate the
process of meeting security guidelines. Attackers update their tactics
frequently to avoid detection and leverage legitimate credentials with tools
that most companies allow in their networks, making detection and subsequently,
response challenging for defenders. In such cases Network Traffic Analysis can
gain prove helpful.
Networking Primer - Layers 1-4
How many
layers does the OSI model have?
How many layers
are there in the TCP/IP model?
True or
False: Routers operate at layer 2 of the OSI model?
What
addressing mechanism is used at the Link Layer of the TCP/IP model?
At what layer of the OSI model is a PDU encapsulated into a packet? ( the
number )
What
addressing mechanism utilizes a 32-bit address?
What
Transport layer protocol is connection oriented?
Transport
Layer protocol is considered unreliable?
TCP's
three-way handshake consists of 3 packets: 1.Syn, 2.Syn & ACK, 3. _? What
is the final packet of the handshake?
Networking Primer - Layers 5-7
What is the default operational mode method used by
FTP?
FTP utilizes what two ports for command and data
transfer? (separate the two numbers with a space)
Does SMB utilize TCP or UDP as its transport layer
protocol?
SMB has moved to using what TCP port?
Hypertext Transfer Protocol uses what well known TCP
port number?
What HTTP method is used to request information and
content from the webserver?
What web based protocol uses TLS as a security
measure?
True or False: when utilizing HTTPS, all data sent
across the session will appear as TLS Application data?
Tcpdump Fundamentals
Utilizing the output shown in question-1.png,
who is the server in this communication? (IP Address)
Were absolute or relative sequence numbers
used during the capture? (see question-1.zip to answer)
If I wish to start a capture without hostname
resolution, verbose output, showing contents in ASCII and hex, and grab the
first 100 packets; what are the switches used? please answer in the order the
switches are asked for in the question.
Given the capture file at /tmp/capture.pcap,
what tcpdump command will enable you to read from the capture and show the
output contents in Hex and ASCII? (Please use best practices when using
switches)
What TCPDump switch will increase the
verbosity of our output? ( Include the - with the proper switch )
What built in terminal help reference can tell
us more about TCPDump?
What TCPDump switch will let me write my
output to a file?
Tasks
Task #1
Validate Tcpdump
is installed on our machine.

Task #2
Start a capture.

Task #3
Utilize Basic
Capture Filters. (see screenshot below)
Task #4
Save a Capture
to a .PCAP file.

Task #5
Read the Capture
from a .PCAP file.

Interrogating Network Traffic With Capture and Display
Filters
Tasks
Utilizing TCPDump-lab-2.zip in
the optional resources, perform the lab to the best of your ability. Finding
everything on the first shot is not the goal. Our understanding of the concepts
is our primary concern. As we perform these actions repeatedly, it will get
easier.
Task
#1
Read a
capture from a file without filters implemented.
To start,
let's examine this pcap with no filters applied.

Task
#2
Identify
the type of traffic seen.
Take note
of what types of traffic can be seen. (Ports utilized, protocols, any other
information you deem relevant.) What filters can we use to make this task
easier?
What type
of traffic do we see?
Common
protocols: HTTP UDP HTTPS

Ports
utilized:
443 80 53

Click
to show answers
Task
#3
Identify
conversations.
We have
examined the basics of this traffic, now determine if you notice any patterns
with the traffic.
Are you noticing any common connections between a server and host? If so, who?
What are
the client and server port numbers used in the first full TCP three-way
handshake?
Server Port: 54940
Client Port: 443

Who are
the servers in these conversations? How do we know?
Server IP
13.35.106.128
207.244.88.140
95.216.26.30
172.16.146.1
Who are
the receiving hosts?
Client IP
172.16.146.2
172.16.146.1.53
172.16.146.2.
Task
#4
Interpret
the capture in depth.
Now that
we have some familiarity with the pcap file, let's do some analysis. Utilize
whatever syntax necessary to accomplish answering the questions below.
What is
the timestamp of the first established conversation in the pcap file?
11:33:58
What is
the IP address/s of apache.org from the DNS server responses?
IP 172.16.146.1.
What
protocol is being utilized in that first conversation? (name/#)
HTTPS
Task
#5
Filter out
traffic.
It's time
to clear some of this data out now. Reload the pcap file and filter out all
traffic that is not DNS. What can you see?
Who is the
DNS server for this segment?
172.16.146.1.domain
What
domain name/s were requested in the pcap file?
fonts.googleapis.com
cse.google.com
safebrowsing.googleapis.com
What type
of DNS Records could be seen?
AAAA Records
Now that
we are only seeing DNS traffic and have a better grasp on how the packet
appears, try to answer the following questions regarding name resolution in the
enterprise: Who requests an A record for apache.org? (hostname or IP)
IP 172.16.146.2.57752
What
information does an A record provide?
11:34:02.434072 IP 172.16.146.1.domain
> 172.16.146.2.36324: 24523 17/0/0 CNAME youtube-ui.l.google.com., A
64.233.177.91, A 172.217.3.238, A 172.217.2.46, A 172.217.0.142, A
74.125.21.93, A 74.125.21.190, A 74.125.21.91, A 142.250.105.91, A
172.217.165.46, A 172.253.124.190, A 74.125.136.190, A 74.125.136.91, A
74.125.136.136, A 142.250.9.91, A 142.250.9.136, A 108.177.122.190 (323)
Who is the
responding DNS server in the pcap? (hostname or IP)
172.16.146.1.domain
Task
#6
Filter for
TCP traffic.
Now that
we have a clear idea of our DNS server let's look for any webservers present.
Filter out the view so that we only see the traffic pertaining to HTTP or
HTTPS. What web pages were requested?
What are
the most common HTTP request methods from this PCAP?
POST

What is
the most common HTTP response from this PCAP?
Click
to show answer
Task
#7
What can
you determine about the server in the first conversation.
Let's take
a closer look. What can be determined about the webserver in the first
conversation? Does anything stick out? For some clarity, make sure our view
includes the Hex and ASCII output for the pcap.
Can we
determine what application is running the webserver?
Analysis with Wireshark
True
or False: Wireshark can run on both Windows and Linux.
Which
Pane allows a user to see a summary of each packet grabbed during the capture?
Which
pane provides you insight into the traffic you captured and displays it in both
ASCII and Hex?
What
switch is used with TShark to list possible interfaces to capture on?
What
switch allows us to apply filters in TShark?
Is
a capture filter applied before the capture starts or after? (answer before or
after)
Tasks
Task #1
Validate Wireshark is
installed, then open Wireshark and familiarize yourself with the GUI windows
and toolbars.
Take a minute and explore
the Wireshark GUI. Ensure we know what options reside under which tabs in the
command menus. Please pay special attention to the Capture tab and what resides
within it.
Task #2
Select an interface to run
a capture on and create a capture filter to show only traffic to and from your
host IP.
Choose your active
interface (eth0, or your Wifi card) to capture from.

Task #3
Create a capture filter.
Next, we want to create a
capture filter to only show us traffic sourcing from or destined to our IP
address and apply it.

Task #4
Navigate to a webpage to
generate some traffic.
Open a web browser and
navigate to pepsi.com. Repeat this step for http://apache.org. While the page
is loading, switch back to the Wireshark window. We should see traffic flowing
through our capture window. Once the page has loaded, stop the capture by
clicking on the red square labeled Stop in the action bar.
Task #5
Use the capture results to
answer the following questions.
Are multiple sessions
being established between the machine and the webserver? How can you tell?
What application-level
protocols are displayed in the results?
Can we discern anything in
clear text? What was it?
Wireshark Advanced Usage
Which plugin tab can
provide us with a way to view conversation metadata and even protocol
breakdowns for the entire PCAP file?
Statistics
What plugin tab will allow
me to accomplish tasks such as applying filters, following streams, and viewing
expert info?
Analyze
What stream oriented Transport
protocol enables us to follow and rebuild conversations and the included data?
Tcp
True or False: Wireshark
can extract files from HTTP traffic.
True
True or False: The
ftp-data filter will show us any data sent over TCP port 21.
false
Packet Inception, Dissecting
Network Traffic with Wireshark
Task #1
Open a pre-captured file (HTTP
extraction)
In Wireshark, Select File → Open →
, then browse to Wireshark-lab-2.pcap. Open the file.
Task #2
Filter the results.
Now that we have the pcap file
open in Wireshark, we can see quite a lot of traffic within this capture file.
It has around 1171 packets total, and of those, less than 20 are HTTP packets
specifically. Take a minute to examine the pcap file, become familiar with the
conversations being had while thinking of the task to accomplish. Our goal is
to extract potential images embedded for evidence. Based on what has been asked
of us, let's clear our view by filtering for HTTP traffic only.
Apply a filter to include only
HTTP (80/TCP) requests.

Task #3
Follow the stream and extract the
item(s) found.
So now that we have established
there is HTTP traffic in this capture file, let's try to grab some of the items
inside as requested. The first thing we need to do is follow the stream for one
of the file transfers. With our http filter still applied, look for one of the
lines in which the Web Server responds with a “200 OK” message which acts as an
acknowledgment/receipt to a users’ GET request. Now let's select that packet
and follow the TCP stream.

Now that we validated the transfer
happened, Wireshark can make it extremely easy to extract files from HTTP
traffic. We can check to see if an image file was pulled down by looking for
the JFIF format in the packets. The JPEG File Interchange Format JFIF will
alert us to the presence of any JPEG image files. We are looking for this
format because it is the most common file type for images alongside the png
format. With that in mind, we will likely see an image in this format for our
investigation.
Check for the presence of JFIF
files in the HTTP traffic.
Click to show answer
Now that we are sure image files
were transferred between the suspicious host and the server let's grab them out
of the capture. To do this, we need to export the objects out of the HTTP
traffic.

Click to show answer
At this point, we should now have
the image files that our security manager requested us to capture if they
existed. They can now examine the file to determine if any data was hidden
within it.


Connectivity to Lab
Access to the lab environment to
complete this part of the lab will be a bit different. We are using XfreeRDP to
provide us desktop access to the lab virtual machine to utilize Wireshark from
within the environment.
We will be connecting to the
Academy lab like normal utilizing your own VM with a HTB Academy VPN key or the
Pwnbox built into the module section. You can start the FreeRDP client on the
Pwnbox by typing the following into your shell once the target spawns:
Code: bash
xfreerdp /v:<target IP>
/u:htb-student /p:HTB_@cademy_stdnt!
You can find the target IP,
Username, and Password needed below:
Click below in the Questions
section to spawn the target host and obtain an IP address.
IP == 10.129.236.135
Username == htb-student
Password == HTB_@cademy_stdnt!

Start a Wireshark Capture
We will be sniffing traffic from
the host we logged into from our own VM or Pwnbox. Utilizing interface ENS224
in Wireshark, let the capture run for a few minutes before stopping it. Our
goal is to determine if anything is happening with the user's host and another
machine on the corporate or external networks.

Self Analysis
Before following these tasks
below, take the time to step through our pcap traffic unguided. Use the skills
we have previously tested, such as following streams, analysis of
conversations, and other skills to determine what is going on. Keep these
questions in mind while performing analysis:
How many conversations can be
seen?
10
Can we determine who the clients
and servers are?
Client 172.16.10.2
Servers 172.16.10.20
What protocols are being utilized?
TCP
HTTP
FTP
ARP
Is anything of note happening? (
ports being misused, clear text traffic or credentials, etc.)
YES, Anoymous user login through the FTP protocol

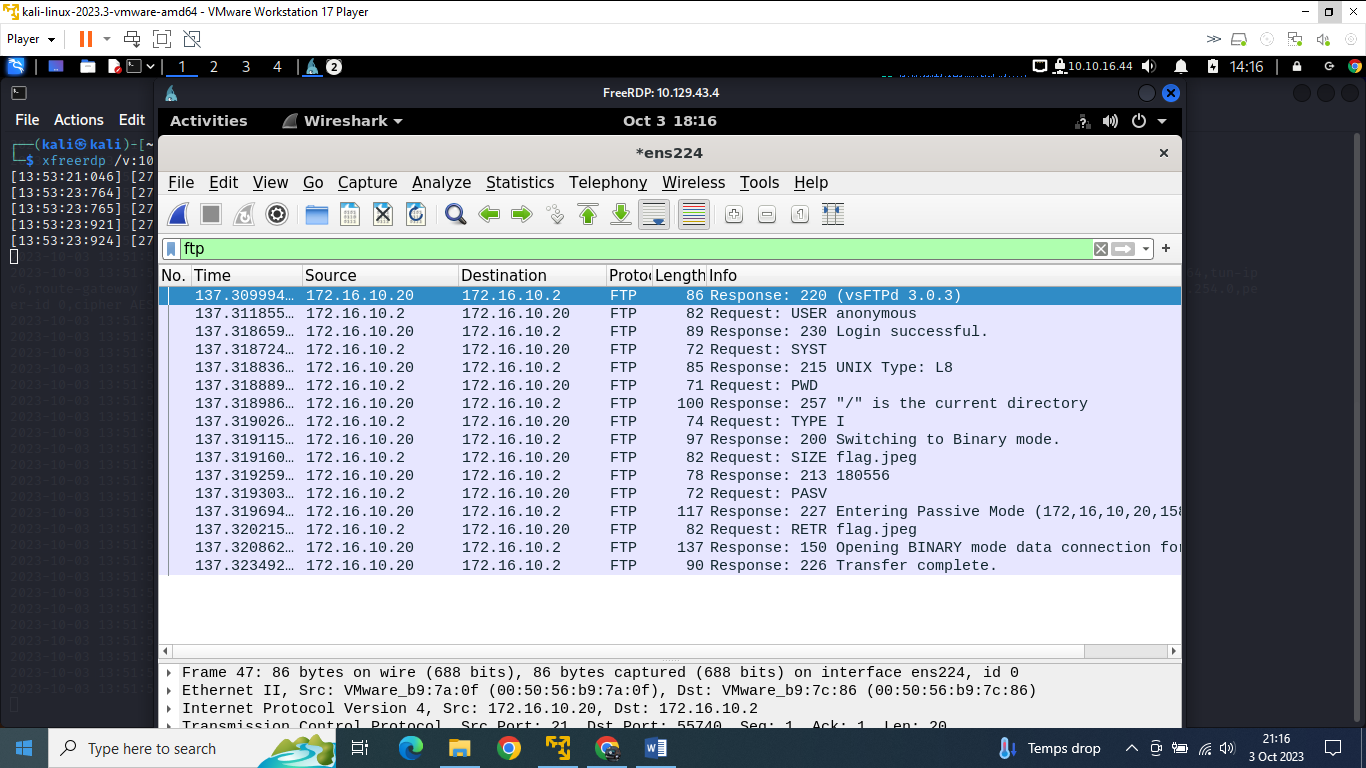
FTP Analysis
When examining
the traffic, we captured, was any traffic pertaining to FTP noticed? Who was
the server for that traffic?
Yes
172.16.10.2
Were we able to
determine if an authenticated user was performing these actions, or were they anonymous?
Anonymous User
Filter the results
Now that we have
seen some interesting traffic, let's try and grab the file off the wire.
Examine the FTP
commands to determine what you need to inspect, and then extract the files from
ftp-data and reassemble it

HTTP Analysis
We should have
seen a bit of HTTP traffic as well. Was this the case for you?
YES
If so, could we
determine who the webserver is?
172.16.10.20
Guided Lab: Traffic Analysis Workflow
What was the name
of the new user created on mrb3n's host?
hacker
How many total
packets were there in the Guided-analysis PCAP?
44
What was the
suspicious port that was being used?
4444
Decrypting RDP connections
What user account
was used to initiate the RDP connection?
Bucky
Conclusion
I have always seen Wireshark as a tool to monitor network but it has taken me to practically do it to realize that it can pick files from the wire something that would be helpful. When it comes to monitoring network, there is a lot of junk hence making the work complicated. Learning about filters and understanding protocols makes work easier since I got to know what to look for. The most obvious was the anonymous login through ftp protocol. I am more into Wireshark than TCPdump due to the Gui. It makes work so easy.
And the journey begins...
ReplyDelete